Extracting valuable extra information from the EEG
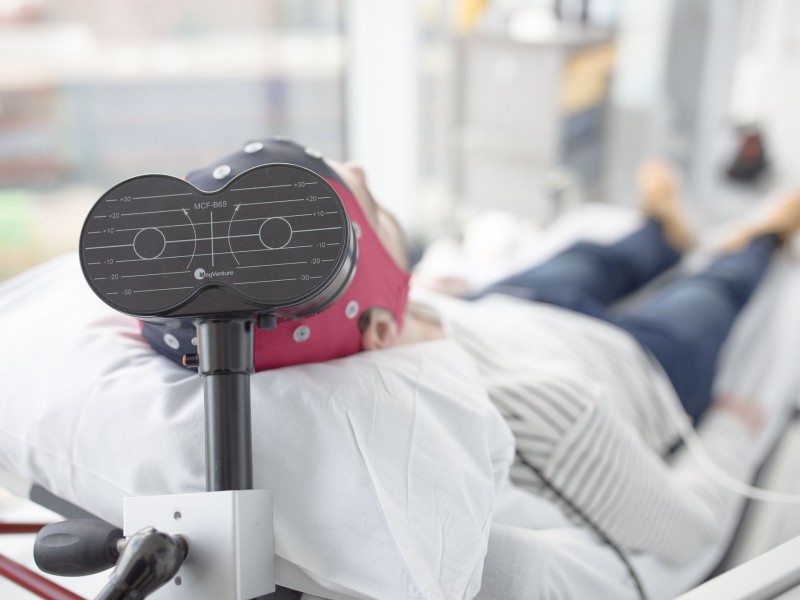
The Biomarker Engineering and Analytics (BEA) group is developing a package of additional analysis techniques to extract more information from study participants' resting state EEGs. Several CHDR clients have already made use of this additional information.
'The idea for this new service arose during a brainstorming session of our group,' says Dr Robert Jan Doll, Associate Director Biomarker Engineering and Analytics. 'We knew that there was much more information to be extracted from the electroencephalography (EEG) of study participants than the contents of our standard report. We measure across the whole brain, but we only report a few leads as standard. Moreover, we have the capability to analyse the EEG data in much more depth. The standard reporting is often enough, but for some clients we thought it might be interesting to have that extra information available.'
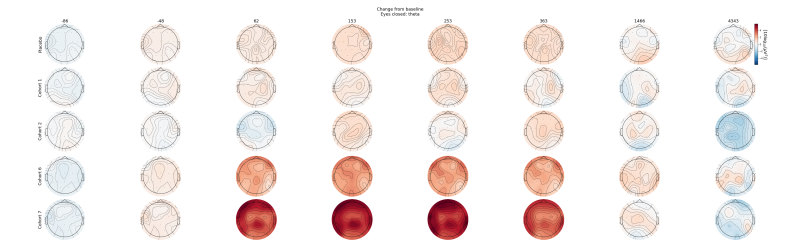
The group developed and technically validated a processing pipeline, with added features in terms of data cleaning and additional analysis steps. The approach proved to provide added value. The first reports are already on clients' desks. Doll: 'We present the additional information in an accessible way, with clear graphics, so the client can see the effect of their investigational compound on the brain activity at different doses and different timepoints relative to dosing.'
The graphs can show at a glance how different frequency bands change over time or with increasing dosage. For instance, the graphs may show an increased theta wave activity during the first hours after administration compared to placebo which normalises after five hours. A more striking visualisation presents the activity in the theta band for the whole of the skull (figure 1). 'For our client's preclinical scientists, this was very useful information when deciding on further clinical development of this compound.'
Statistics
The additional results generated using this enhanced processing pipeline are based on aggregated results from subjects in a trial. Doll: 'Some clients would also like to have a statistical analysis that shows significant changes in clusters of electrodes and frequencies due to drug effects. Also, the analysis is then no longer limited to predefined bands such as alpha, beta, etc. That is one of the projects our newly hired PhD student Naser Hakimi is working on. It’s quite a challenge because we can analyse so many biomarkers at the same time. If we apply the usual statistics, we run an increased risk of false positives. So now, Naser is developing ways to solve that puzzle. For us as scientists, it is interesting to go deeper into EEG analysis, and for clients this proves to be a valuable additional service.'
Interested in learning more?
More articles from Developing methods